> ## Documentation Index
> Fetch the complete documentation index at: https://docs.adsera.in/llms.txt
> Use this file to discover all available pages before exploring further.
# Analyzing Campaign Reports
> Understand your email campaign performance with in-depth analytics on deliverability, opens, clicks, and unsubscribes.
After sending an email campaign, understanding its performance is key to optimizing your future marketing efforts. AdsEra's Campaign Report provides crucial insights into how your recipients are engaging with your emails.
### How to Access Your Campaign Report
From your AdsEra Dashboard, click on **Campaigns** then **Email** in the left-hand navigation bar.
On the Campaign List page, locate the sent campaign you wish to analyze.
On that campaign's card, click the **"View complete campaign analysis"** button or open the **three-dots (...) menu** and select **Report**.
***
## Understanding the Report Interface
At the top of your report, you'll find essential campaign details and a graph filter that applies to all tabs.
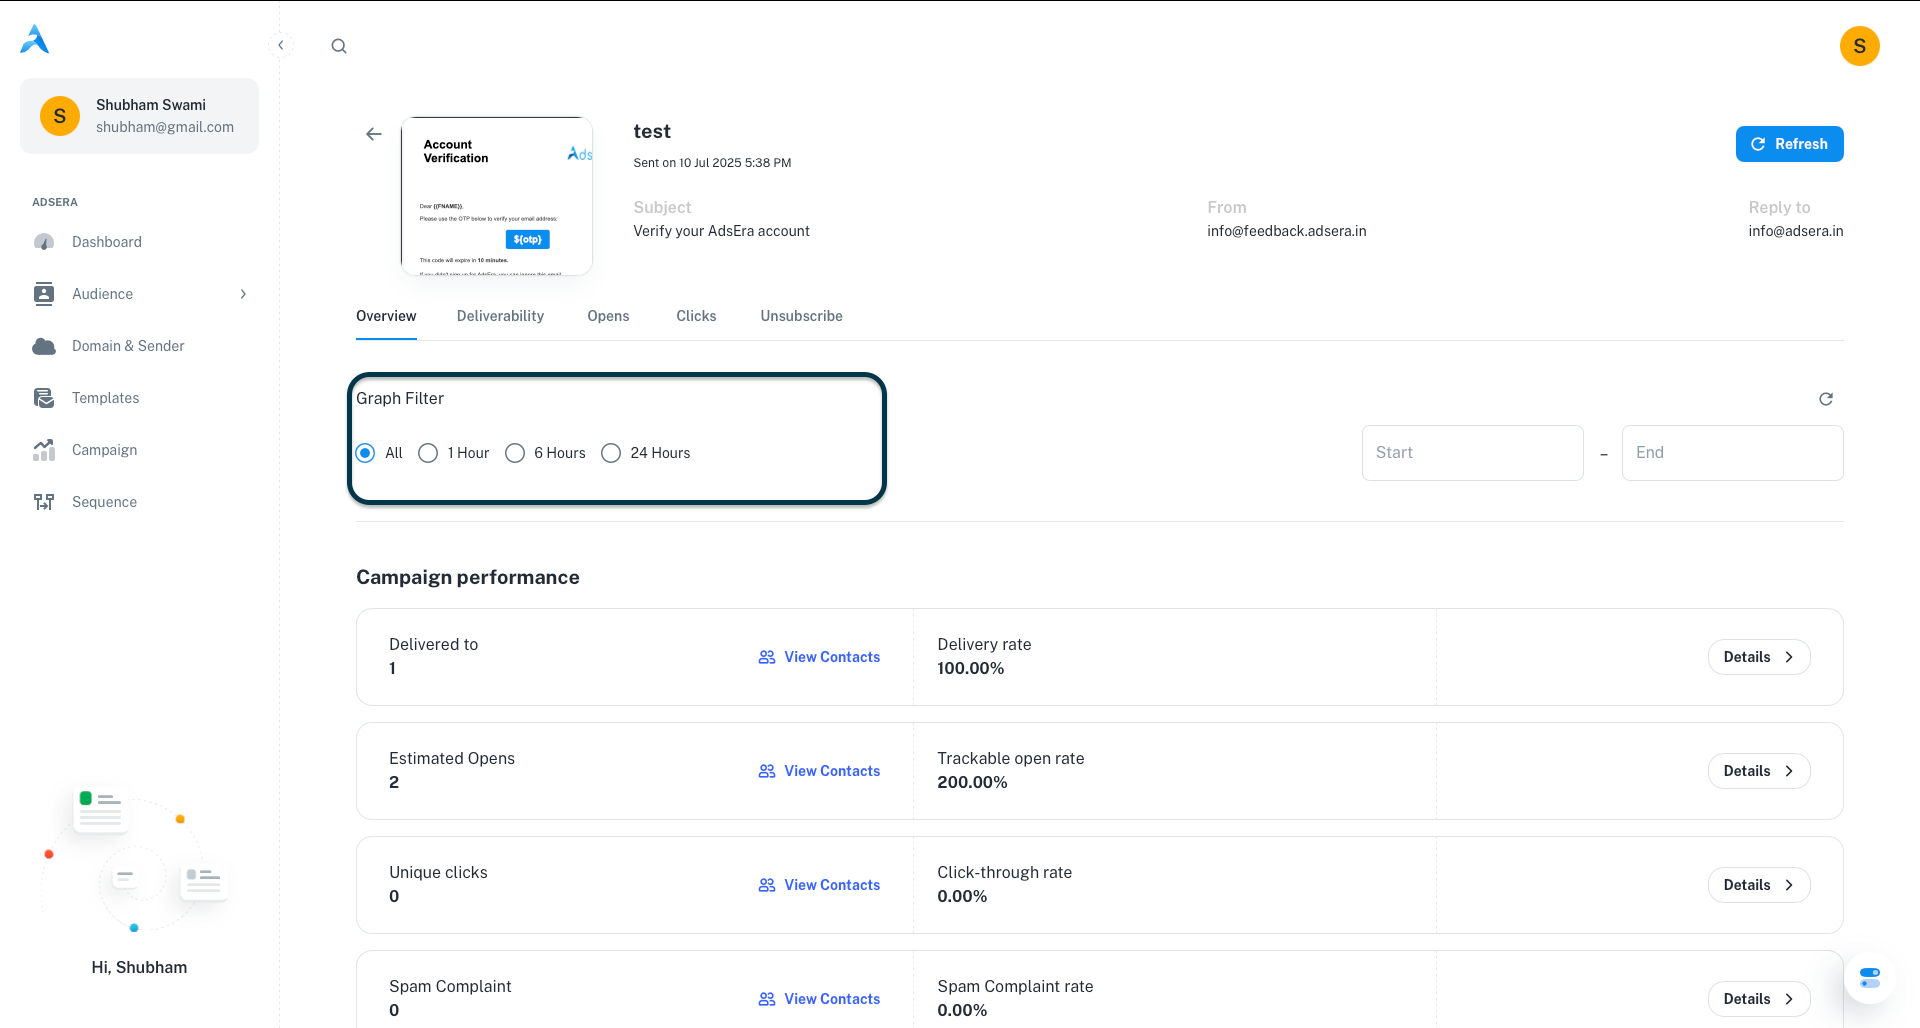
* **Campaign Details:** Includes the **Subject**, **From** address, and **Reply to** address.
* **Graph Filter:** Allows you to view performance data over specific timeframes: **1 Hour**, **6 Hours**, **24 Hours**, or a **custom date range**.
The main report is divided into the following tabs:
The **Overview** tab is your go-to for a quick summary of your campaign's key performance indicators (KPIs).
| Metric | Definition & Interpretation |
| :---------------------- | :-------------------------------------------------------------------------------------------------------------------------------------------------------- |
| **Delivery Rate** | The percentage of emails that were successfully delivered. A high rate (ideally 98%+) indicates a healthy contact list. |
| **Trackable Open Rate** | The percentage of *delivered* emails that were opened. This is a crucial metric for measuring your subject line's effectiveness. |
| **Click-through Rate** | The percentage of *delivered* emails that resulted in at least one unique click. This measures how effective your content and calls-to-action (CTAs) are. |
| **Unsubscribe Rate** | The percentage of delivered emails that resulted in an unsubscribe. A low rate suggests your content is relevant to your audience. |
| **Spam Complaint Rate** | The percentage of delivered emails marked as spam. Keep this as low as possible, as it directly impacts your sender reputation. |
Below these metrics, a graph visualizes key activities (Opens, Clicks, Bounces, etc.) over time.
This tab provides a detailed breakdown of your email delivery success. It shows the total **Recipients**, how many emails were **Sent**, and how many were successfully **Delivered**.
This section lists all contacts who received your email. You can select contacts from this list and click **"Create New List"** to generate a new, targeted list of successfully reached users.
You'll also see a breakdown of bounces:
* **Soft Bounces:** Emails that were temporarily undeliverable (e.g., mailbox full).
* **Hard Bounces:** Emails that are permanently undeliverable (e.g., invalid address). These contacts are automatically suppressed to protect your sender reputation.
These tabs offer a granular view of user engagement.
#### Opens
See the total opens vs. unique opens, your open rate, and the last open time. The list below shows exactly who opened your email and when.
#### Clicks
This is where you measure direct interaction.
* **Key Metrics:** Track total clicks, unique clicks, click-to-open rate (CTOR), and average time to click. A high CTOR indicates very effective content.
* **Click Breakdown:** See which **Browsers**, **Countries**, and **Operating Systems** your audience uses.
* **Link Performance:** The "Smart Segregation" table shows which specific **Links** each contact clicked, helping you identify your most popular content.
You can create a new list of contacts who opened or clicked your campaign directly from these tabs, allowing for powerful re-engagement campaigns.
This tab provides crucial information on recipients who opted out or marked your email as spam.
**Monitor These Metrics Closely!** A high "Unsubscribe rate" or "Spam complaint rate" can seriously harm your sender reputation and future deliverability. If these numbers are high, review your content, audience targeting, and sending frequency.
The list in this tab shows you exactly who unsubscribed or complained, helping you maintain a clean and engaged audience.
***
## Pro Tips for Analyzing Your Reports
Compare your campaign's performance against your own past campaigns and industry averages to set clear goals for improvement.
Use the "Create New List" feature in each tab to build new segments of highly engaged users (like "All Clickers") or unengaged users for re-engagement campaigns.